H-R Diagrams

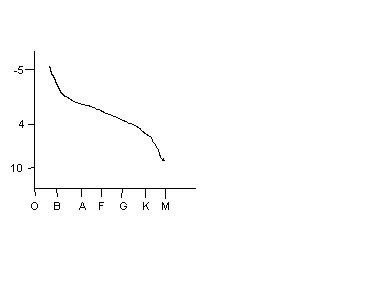
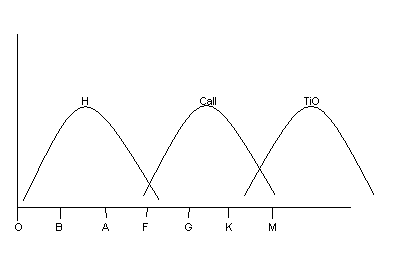
Spectral Types
Saha equation predicts which species are prominent at each temperature
Some species have prominent absorption lines

O stars
M ~ 20 Msun
L ~ 20000Lsun T = Tsun/1000 ~ 10 mission years
Very brief lifetime
M stars
M ~ 0.2 Msun
L ~ 0.01 Lsun T = 20 Tsun ~ 300 billion years
Last a LONG time
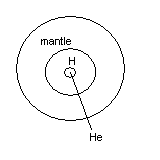
When H is exhausted, He begins burning
Clusters in the same area of diagram are all the same age
Stellar Evolution
Stars spend from 300 billion to 1 million years, then they start burning helium

When He burning commences, the size of the star increases. When this happens to our sun, the size will extend to the Mars orbit. However, the core shrinks
He burning RT ~ constant
Core would be approximately the size of the Earth
 10^-5 times less dense than air
The star is then held up by radiation, and it begins moving rapidly on HR diagram
Loses Mass
What is to hold matter back?
Much of the mass of the star boils off and returns to interstellar space
After He is burned, the star shortly collapses to become a white dwarf.
We know this to be true because we can look at globular clusters formed at once from the same material – only the mass differs.
![]()